
12 B2B Lead Generation KPIs Every Revenue Team Should Be Tracking in 2026


Dalia Arroyo
Without data and benchmarks, you can’t track improvement and spot opportunities. That’s especially true in B2B sales, where a single missed signal can spiral into lost revenue. So, how do you determine which B2B lead generation KPIs to track that actually move the needle?
Below, we’ve compiled 12 of the most important lead generation performance indicators and benchmarks that your revenue team should be tracking to help you understand where you stand. We also split them by metric type, which gives you a more holistic view of your revenue operations activities.

The Essential Guide to Sales Pipeline Management
Learn our strategic approach to tracking prospects throughout the pipeline, forecasting revenue, and closing more deals.
What is a KPI?
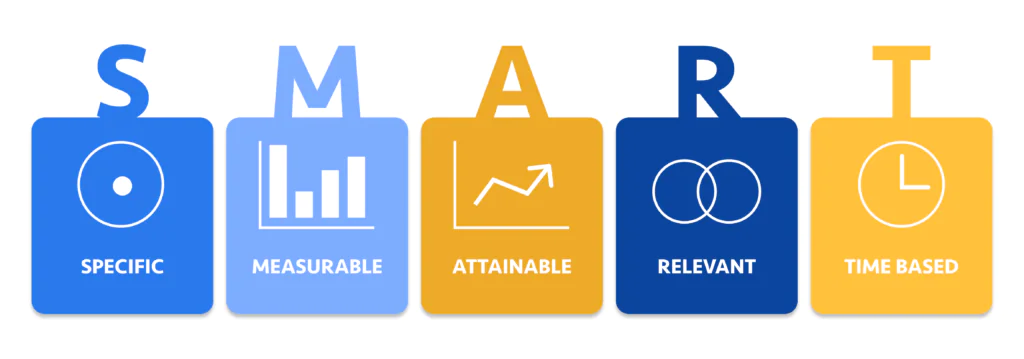
A KPI (key performance indicator) is a realistic, measurable goal that evaluates growth and productivity over a given time period. Often, they are aligned with the SMART goals framework to ensure metrics are easy to track and optimize.
Now that we’ve defined what a KPI is, let’s dive into the 12 KPIs you should be tracking for lead generation.
1. Number of Marketing Qualified Leads (MQLs)
A marketing-qualified lead (MQL) is a person who has shown some interest in purchasing from you and meets your ideal customer profile (ICP). Typically, they are in the Awareness and Consideration stages of the buyer’s journey.
Tracking MQL volume helps you gauge whether your business development outreach and marketing efforts are generating enough interest to sustain your pipeline.
Every month, your company should attract 50-150 MQLs.
2. Number of Sales Qualified Leads (SQLs)
A sales-qualified lead (SQL) is someone who has shown high intent in purchasing your solution. Therefore, they are typically further along the buyer’s journey compared to your MQL.
A healthy SQL number indicates whether your sales and marketing teams are attracting high-quality prospects with real revenue opportunities entering the sales pipeline.
Every month, you should aim to attract 14-45 SQLs.
3. Monthly Site Traffic Growth Rate
Think about: your website makes or breaks your prospects’ first impression of you. While site traffic does not close deals, a consistent and growing stream of qualified visitors is a strong indicator of brand visibility and marketing material effectiveness.
We also recommend you monitor traffic by source (organic, paid, direct, and referrals) to better understand what’s driving audience growth.
Every month, you should try to grow your monthly site traffic by 2-5%.
4. MQL Growth Rate (Year-over-Year)
As with monthly site traffic, it’s important to track your MQL volume growth — it lets you measure momentum and justify marketing investment.
However, we like to preface by saying that MQLs don’t tell us the whole picture. Ultimately, your marketing team shouldn’t be so focused on bringing in any lead possible that they waste a lot of salespeople’s time.
Every year, you should aim to reach a 5% MQL growth rate.
5. MQL to SQL Conversion Rate
Your lead generation team’s goal is to convert an MQL into an SQL, so a high conversion rate indicates a strong sales-marketing alignment. This means that the marketing team has worked hard to draw in have high potential to become paying customers in the end, shortening your sales cycle and boosting revenue overall.
Every month, you should aim for a 20-30% MQL to SQL conversion rate.
6. SQL to SQO Conversion Rate
An SQO (sales-qualified opportunity) is closer to a purchasing decision than an SQL, signifying a deeper level of intent as they evaluate their options.
The SQL to SQO conversion rate measures the effectiveness of your initial business development outreach and qualification process. If you find that the number is consistently low, it might be time to revisit your discovery call framework and ICP definition.
Every month, you should aim for a 50-55% SQL to SQO conversion rate.
7. MQL to Win Rate
Zooming out a bit, the MQL to Win Rate measures the full revenue-driving operations from the first marketing touch to the closed deal. It’s one of the most powerful indicators of the alignment between marketing, appointment setting, sales, and customer service.
Every month, you should aim for a 6+% MQL to Win Rate.
8. Number of Appointments Completed
Completed appointments are a direct indicator of your business development rep (BDR) productivity. Tracking this metric allows you to identify no-show trends, evaluate your sales cadence, and ensure your team is actively generating enough pipeline activity to hit sales quotas.
Every month, your BDRs should complete 10-20 sales appointments.
9. Number of Calls per Month
Cold calling is not dead and remains a key outbound sales activity to grow your brand visibility. While quality always matters more than quantity, a baseline call volume benchmark allows you to set productivity expectations and spot underperformance early.
Every month, one of your SDRs should make 400-600 calls.
10. Cost Per Lead (CPL)
CPL measures how much you are spending to generate each lead. Keep in mind, this benchmark will vary depending on whether you are running inbound or outbound lead generation campaigns — so make sure you keep these two metrics separately.
Inbound leads should cost $100-300, whereas outbound leads should cost $300-600.
11. Cost per Acquisition (CPA)
CPA tells you the cost it takes to acquire a new customer, factoring in all marketing and sales spend. This is the ultimate efficiency metric for your revenue operations program and a critical input for calculating ROI.
Your CPA should be $2000-6000.
12. Sales Cycle Length
A sales cycle assesses how long it takes for a lead to move through your entire buyer’s journey from first touch to closed-won. Tracking your sales cycle length helps you forecast revenue more accurately, identify bottlenecks, and set realistic pipeline coverage targets.
The average B2B sales cycle length is anywhere between 21 and 45 days.
5 Considerations When Developing KPIs for Lead Generation
While benchmarks are a useful starting point, they should not be treated as one-size-fits-all. Before you begin frantically researching what your industry averages lead generation KPIs look like, consider the following factor that can significantly impact what “success” looks like for your organization:
- Company maturity: Early-stage companies that are building their go-to-market strategy from scratch will have a lower number of leads in their pipeline compared to established enterprises with mature demand generation programs.
- Team experience: More experienced revenue operations leaders can optimize conversion rates and reduce friction points across the funnel faster.
- Primary sales motion: Leveraging both inbound and outbound channels will have different cost structures, cycle lengths, and conversion rate expectations.
- Sales process complexity: Organizations with large buying committees and high industry regulation considerations will naturally have a longer sales cycle and cost more to close.
- Average deal size: Higher deals justify higher acquisition costs and longer sales cycles.
The Essential Guide to Sales Pipeline Management
Learn our strategic approach to tracking prospects throughout the pipeline, forecasting revenue, and closing more deals.
Exceed Your Lead Generation KPIs with EBQ
Knowing your numbers is just the beginning. Consistently exceeding these 12 KPIs ultimately depends on the right processes, talent, and technology working in synergy.
EBQ helps B2B companies build and scale high-performing revenue operations programs designed to drive predictable growth. From marketing to appointment setting to closing deals, we have the people (and expertise) necessary to expand each step of your revenue cycle. Visit our B2B lead generation services page to learn more.
About the Author:
Dalia is EBQ’s VP of Business Development with over 10 years of experience in customer service. After forming the Customer Experience division, she achieved over $1.2M in revenue within the first six months under her leadership.