Once you’re regularly closing new business, you need to analyze your pipeline to see where improvements can be made and how you can optimize your sales process. Sales pipeline management requires meticulous review of your sales team’s performance metrics. How many deals are you closing, and how efficiently are you closing them?
Below are some of the most important pipeline metrics you should be tracking.
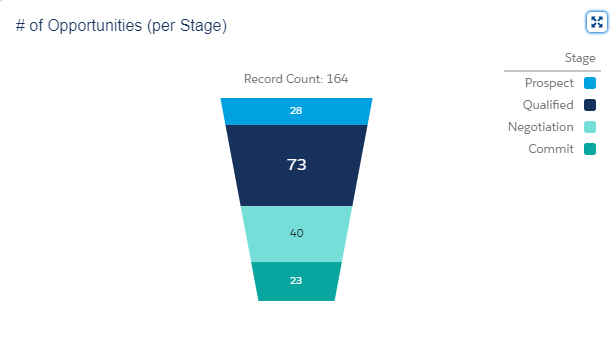
Looking at total opportunities is like a bird’s-eye view of the health of your pipeline. And knowing how many opportunities are in your pipeline at any given point can help you allocate time and resources where they’re most needed.
More importantly, break this number down and look at the number of opportunities in each stage. This helps you determine if there are any bottlenecks in your sales pipeline, so you can spend extra time moving delayed opportunities forward.
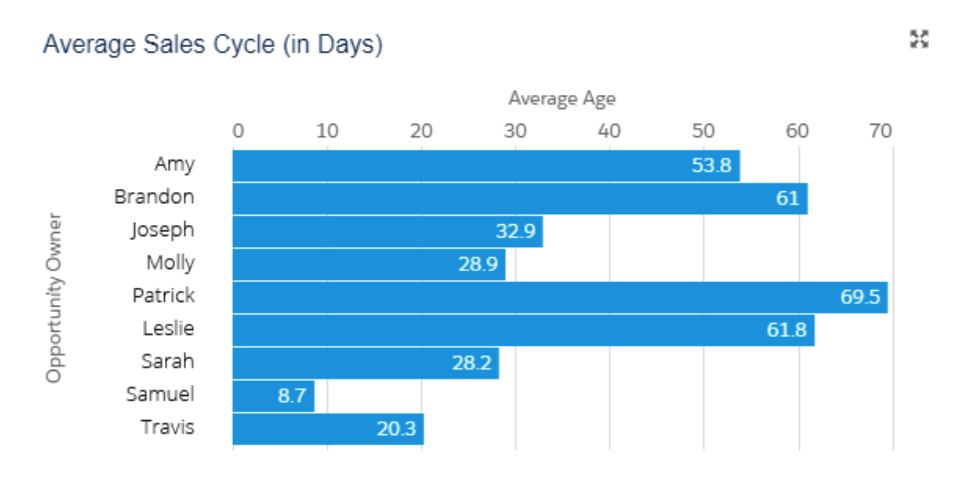
Analyzing the average length of your sales cycle gives you insight into how efficiently your pipeline is performing. B2B sales cycles can be quite long, with most falling anywhere between 2 weeks and 6 months. But you should look for ways to shorten the sales cycle when possible.
If you know how long your sales cycle typically lasts, you can identify certain opportunities that are taking longer to close than usual. Your average sales cycle also helps you predict incoming revenue for a particular month, which tells you whether you’re likely to meet quota and can even help you distribute that revenue where it’s needed.
One of EBQ’s sales outsourcing clients, a resource management software company called Journyx, experiences varied sales cycles — ranging anywhere between that 2 weeks to 6 months length, depending on the scope of the account and solution.
Even with this variation, having insight about their average cycle length allowed Journyx to set suitable quotas for their EBQ sales team, quotas EBQ successfully achieved each month.
“I can add people as I have increased volume to support them, instead of incurring the expense of hiring and training an internal sales team based on projections,” said Journyx President Bill Balcezak about the cost-effectiveness of the outsourced team. Read the full Journyx case study for more information about how EBQ helps companies keep up with their pipeline goals.
Learn our strategic approach to tracking prospects throughout the pipeline, forecasting revenue, and closing more deals.
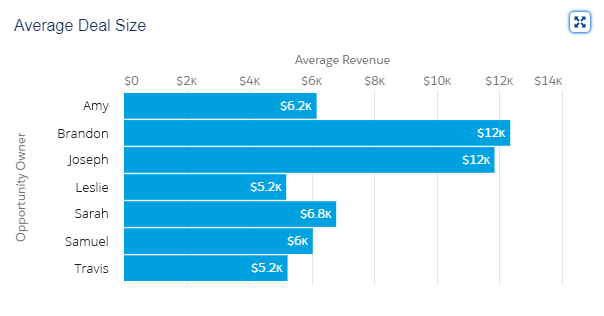
How much do your customers typically spend when they purchase from you? Average deal size is another benchmark that plays a significant role in forecasting revenue month-to-month.
This metric also helps you dig into differences between your high-value and low-value deals, so you can invest more time and effort into accounts with higher return.
This metric is a big one — it tells you how successful your sales team is at nurturing qualified opportunities into customers. Win rate can be calculated by dividing the number of qualified prospects by the number of customers won.
This metric helps you predict the number of deals you will close, based on how many opportunities are in your pipeline. You can also predict how many opportunities will need to be generated in order to convert a certain number of customers.
Your win rate helps you analyze sales performance on both a team and individual rep level.
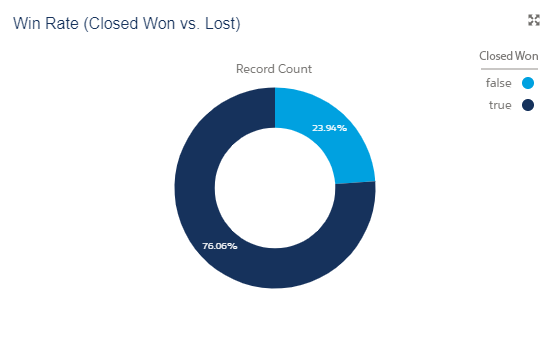
You can use a report like this to measure by rep and find out who your strongest and weakest closers are. This allows you to quickly address any areas where results are lower than expected.
Pipeline velocity is a metric that tells you how much revenue your sales team earns each day. Think of pipeline velocity as the speed at which prospects are moving through your pipeline.
The final dollars-per-day number is not quite as important as each of the 4 metrics used to calculate it, the metrics outlined above. Here’s the formula used to calculate pipeline velocity:
The most interesting aspect of pipeline velocity is the fact that each component of the formula acts as a lever you can use to increase revenue. By improving one metric, you can improve your pipeline overall.
Continue measuring your pipeline regularly and identifying ways to optimize sales performance. These pipeline metrics, and all the other pipeline insights provided in this guide, will help you recognize hidden potential for maximizing revenue.
Proper management of your sales pipeline enables you to tailor your sales process to the ways your customers buy solutions like yours. Become the ultimate problem-solvers for your buyers’ challenges.
Make changes to your process as needed to speed up sales cycles and increase customer lifetime value. Devote extra time and resources to those high-dollar deals, add in relevant pipeline stages or adjust closing probabilities where appropriate, and make sure every sales rep is performing to the best of their abilities.
Now that you know the essentials of sales pipeline management, you can hold your sales team to the highest standard and empower them to take control of the sales cycle.
Learn our strategic approach to tracking prospects throughout the pipeline, forecasting revenue, and closing more deals.
Fill out your information with the form provided and one of our team members will reach out to you shortly.
©EBQ 2024 All rights reserved.
For over 16+ years, we’ve specialized in transforming businesses to industry giants.
Contact one of our Business Consultants to see how we can help you scale.

By submitting this form, you are consenting to being contacted by our sales and marketing teams via the email address and phone number provided. You may opt out at any time. We will not sell or distribute your email address to any third party at any time. View our Privacy Policy for more information.